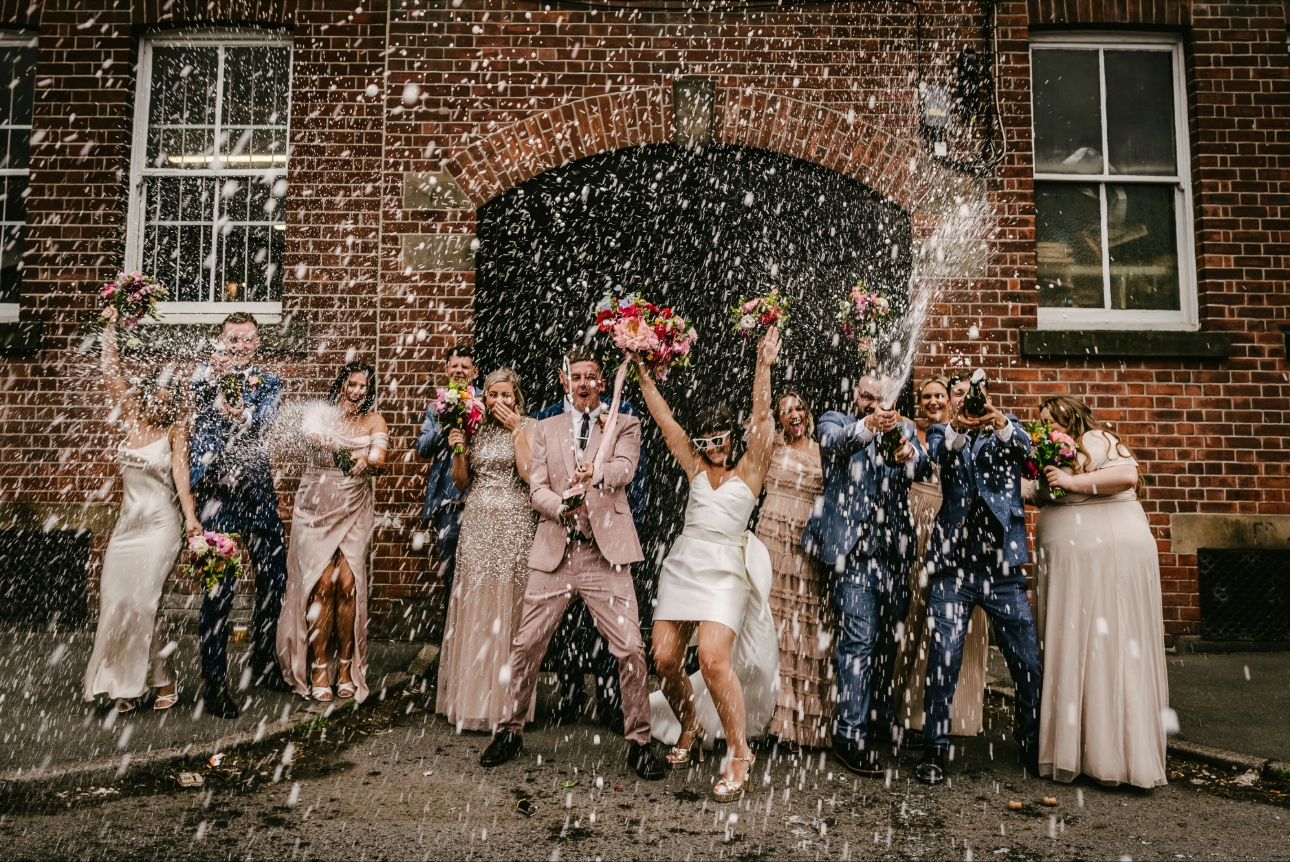
Barn at Alswick Wedding Fair hosted by County Wedding Events
If you're newlyweds-to-be embarking on your wedding planning journey, pop along to the...
Posted by Danielle Harvey on 3 January 2025

Gender breakdown of name changes
After Marriage One of the most frequently discussed aspects of name changes is the gender breakdown. Traditionally, women have been more likely to adopt their husband's surname, but how does the data actually look? Here's what we found: Females who changed their name: 2,479 individuals (85.66%) Males who changed their name: 414 individuals (14.31%) Gender-neutral individuals who changed their name: 1 individual (0.03%) As expected, women account for the vast majority of name changes, though a smaller number of men also choose to change their name. The fact that gender-neutral individuals are changing their name points to a broader, more inclusive shift in societal attitudes toward marriage and identity.
Types of Last Name Changes: Single vs Double Last Names
When it comes to changing a surname, the decision isn't always straightforward. Some people adopt their spouse's surname, while others opt for a double-barrelled surname, combining both their surname and their spouse's. Here's the breakdown:
1. People Who Changed Their Last Name into a Different Single Name: Number of people: 2,637 (90.22%) The majority of individuals (90.22%) who change their last name opt for a single surname, adopting their spouse's name. This has been the traditional route for many years, and it remains the most popular choice.
2. People Who Created a Double Last Name: Number of people: 193 (6.60%) A smaller but still significant portion (6.60%) of individuals choose to create a double last name, hyphenating their surname with their spouse's. This trend reflects a growing desire for individuals to maintain their identity while also embracing their marital connection.
3. People Who Did Not Change Their Last Name: Number of people: 93 (3.18%) A small number of people (3.18%) chose not to change their last name after marriage, either to maintain their personal or professional identity or because they didn't feel the need to adopt their spouse's surname.
The Age Range of People Getting Married in the UK
The age at which people get married can offer a lot of insight into changing societal norms. With marriage rates declining in younger generations and more people choosing to marry later in life, let's take a look at the most common ages for marriage in the UK. Here are the top 10 ages at which people are getting married:
| Age | Number of people | Percent |
| 30 | 213 | 7.29% |
| 29 | 179 | 6.12% |
| 31 | 167 | 5.71% |
| 28 | 164 | 5.61% |
| 33 | 153 | 5.23% |
| 32 | 149 | 5.10% |
| 27 | 142 | 4.86% |
| 34 | 134 | 4.58% |
| 35 | 129 | 4.41% |
| 26 | 120 | 4.11% |
Barn at Alswick Wedding Fair hosted by County Wedding Events
If you're newlyweds-to-be embarking on your wedding planning journey, pop along to the...
Braxted Park Estate Wedding Fair hosted by County Wedding Events
If you're newlyweds-to-be embarking on your wedding planning journey, pop along to...
County Wedding Events coming to Frasers, Kent!
If you're newlyweds-to-be embarking on your wedding planning journey, pop along to the County Wedding...
Wedding expert reveals the top 2025 trends
With weddings becoming more personalised than ever, many couples are rethinking the traditional elements...